Bitcoin price analysis is crucial for understanding the current trends and future potential of the cryptocurrency market. As Bitcoin (BTC) has experienced significant fluctuations, particularly after its meteoric rise of over 600% since December 2022, investors are keenly watching for signs of stability or further decline. The recent trading pattern has revealed critical support levels between $93,910 and $95,700, which will be pivotal in determining whether BTC can sustain its upward momentum or if it is headed towards bearish trends. With many speculating on the Bitcoin cycle, the BTC forecast remains uncertain as technical indicators suggest a potential correction phase. This analysis will delve into these dynamics, shedding light on whether Bitcoin’s price trajectory is poised for a rebound or a downturn.
When examining the fluctuations in Bitcoin’s valuation, it becomes essential to engage in a thorough examination of market cycles and patterns. The current state of BTC reflects a complex interplay of support and resistance levels, with traders closely monitoring recent price actions for indications of future movements. As the cryptocurrency landscape evolves, understanding the implications of bearish trends and bullish reversals is paramount for investors. This exploration of Bitcoin price trends not only aids in forecasting potential outcomes but also highlights the importance of robust technical analysis in navigating the volatile nature of digital currencies. Ultimately, a comprehensive grasp of these factors can inform strategies for capitalizing on opportunities within the cryptocurrency market.
Understanding Bitcoin’s Market Cycle
Bitcoin has undergone various market cycles since its inception, and understanding these cycles is crucial for predicting future price movements. The current cycle, which commenced in December 2022, has seen BTC prices surge over 600%, reaching unprecedented highs. As traders and investors analyze historical data, they often look for patterns that indicate when a market cycle is nearing its peak or bottom. Recent fluctuations suggest that we may be at a pivotal juncture, where the price could either stabilize or enter a corrective phase. This analysis is not only essential for seasoned investors but also for newcomers trying to navigate the cryptocurrency market.
The cyclical nature of Bitcoin prices is influenced by numerous factors, including market sentiment, regulatory developments, and macroeconomic trends. As the cryptocurrency market continues to evolve, understanding the dynamics of Bitcoin’s market cycle becomes increasingly important. Investors should keep an eye on key support and resistance levels, as well as external events that may impact the overall market. The current horizontal trading range reflects a period of consolidation, and discerning whether this is the calm before another significant price movement is essential for making informed trading decisions.
Bitcoin Price Analysis: Current Trends and Predictions
Currently, Bitcoin’s price is entrenched within a horizontal range between $93,000 and $107,000. After reaching an all-time high of $109,356 in January 2025, BTC has struggled to maintain its peak, indicating potential bearish trends in the near term. The technical indicators, such as the RSI and MACD, suggest that the momentum is leaning towards the bearish side. This price analysis underscores the importance of closely monitoring the $93,910-$95,700 support zone, which, if broken, could signal a further downward trend and potentially confirm a bear market initiation.
Future BTC forecasts depend heavily on maintaining critical support levels. If Bitcoin can hold above the $93,910-$95,700 range, there may be a chance for a bullish reversal. Investors are advised to be vigilant; a failure to sustain these support levels could lead to a more significant decline. Market participants should also consider broader cryptocurrency market trends and how they might influence Bitcoin’s trajectory. Staying updated on price action and global economic factors will be key in navigating the uncertain landscape of Bitcoin investments.
The Importance of Support Levels in Bitcoin Trading
Support levels play a crucial role in Bitcoin trading strategies. The current support levels around $93,910-$95,700 are significant not only for technical analysis but also for shaping market sentiment. If Bitcoin can bounce back from these levels, it could signify a potential bottom formation, leading to renewed bullish momentum. However, breaking below these support levels would likely trigger panic selling and amplify bearish trends. Traders often set their stop-loss orders near these critical points to mitigate risks associated with sudden price drops.
Understanding support levels helps traders make informed decisions on entry and exit points. In the context of Bitcoin’s recent trading behavior, the horizontal channel suggests that many investors are waiting for clearer signals before committing to new positions. The interplay between support and resistance levels can provide insights into market psychology. Observing how Bitcoin reacts around these pivotal points can offer clues about future price movements and aid in developing effective trading strategies.
Analyzing Bitcoin’s Resistance Levels
Resistance levels are just as significant as support levels when analyzing Bitcoin’s price action. The recent high of $109,356 in January 2025 established a critical resistance level that Bitcoin struggled to reclaim after its initial breakout. Resistance levels indicate where selling pressure may overcome buying pressure, potentially leading to price reversals. For traders, identifying these resistance points is vital for setting realistic price targets and managing risk.
As Bitcoin attempts to rally, it will face challenges at these resistance levels that could determine the sustainability of any upward movement. Understanding where these resistance points lie can aid investors in formulating strategies around profit-taking and risk management. If Bitcoin manages to break through these resistance levels decisively, it could signal stronger bullish trends. Conversely, repeated failures to break through may reinforce bearish sentiment, leading to increased volatility in the cryptocurrency market.
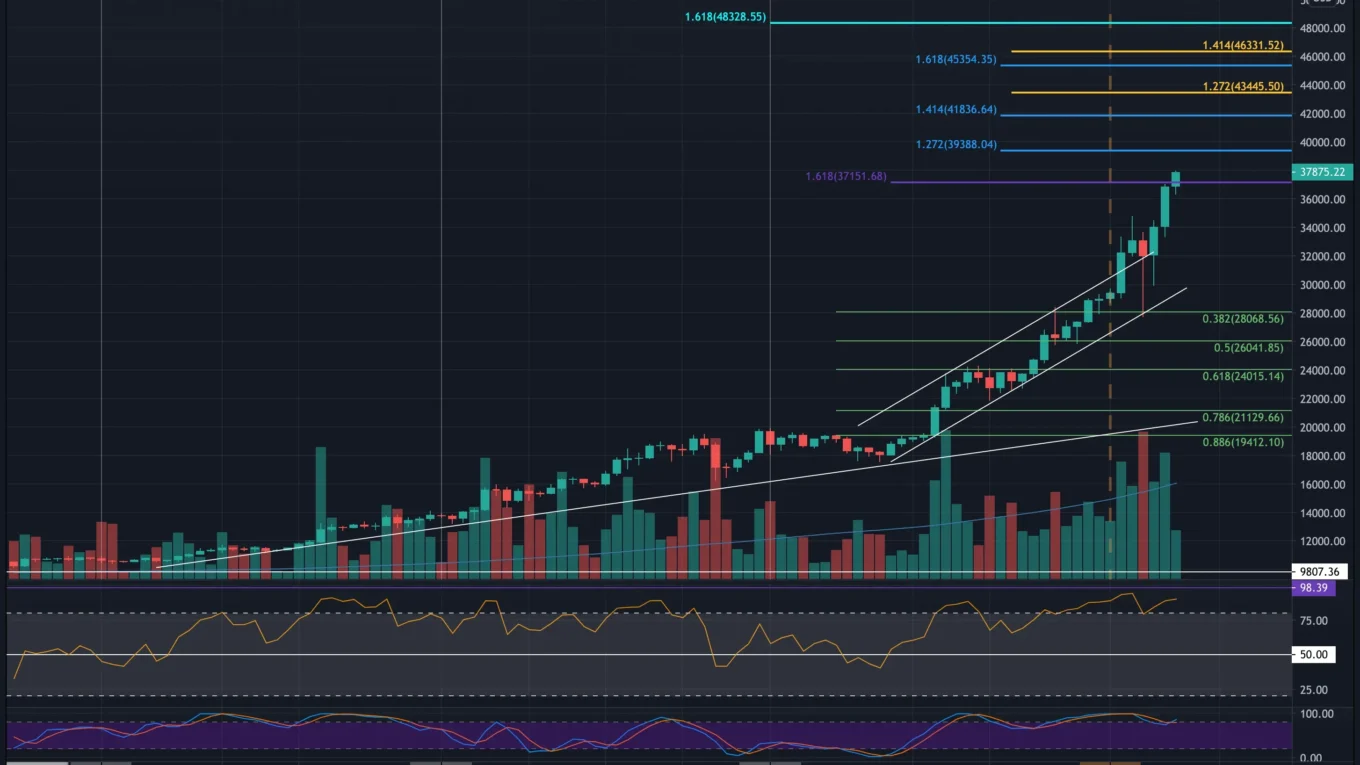
Bitcoin’s Fibonacci Analysis: Implications for Traders
Fibonacci retracement levels are a popular tool among traders for predicting potential reversal points in Bitcoin’s price movements. The recent price action suggests that the Fibonacci resistance levels have played a crucial role in determining Bitcoin’s trajectory. Traders often look to these retracement levels to identify potential support or resistance zones, adding another layer of analysis to their trading strategies. The current price dynamics, combined with these Fibonacci levels, could provide insights into possible future price movements.
As Bitcoin approaches key Fibonacci levels, it is essential for traders to remain vigilant and adjust their strategies accordingly. If Bitcoin can hold above these levels, it may pave the way for further upward movement. Conversely, if the price fails to maintain these levels, it could indicate a bearish reversal. Understanding Fibonacci analysis within the context of Bitcoin’s cycle and overall market trends can provide traders with critical insights for making informed decisions in a volatile market.
The Role of Market Sentiment in Bitcoin Valuation
Market sentiment significantly influences Bitcoin’s price dynamics. As the cryptocurrency market is driven by investor emotions and perceptions, understanding market sentiment can provide key insights into potential price movements. Positive news or developments can trigger bullish trends, while negative sentiment often leads to bearish corrections. The current market atmosphere surrounding Bitcoin is mixed, with some investors feeling optimistic about a potential recovery, while others are wary of the risks associated with a prolonged bearish phase.
Monitoring social media trends, news articles, and market analyses can help gauge the overall sentiment within the cryptocurrency community. This sentiment analysis can be particularly useful for anticipating price movements and making strategic decisions. Traders should also consider how external factors, such as regulatory changes or macroeconomic shifts, may impact Bitcoin’s valuation and overall market sentiment. Staying attuned to these developments can provide a competitive edge in a rapidly changing landscape.
Future Outlook for Bitcoin: Trends to Watch
The future outlook for Bitcoin remains uncertain, but several trends could shape its trajectory in the coming months. As we analyze the current price action and market conditions, it’s crucial to keep an eye on emerging patterns that may indicate the next phase of Bitcoin’s cycle. The potential for a bullish reversal exists if Bitcoin can successfully navigate its support levels and break through key resistance points. Conversely, if bearish trends persist, the market may face a more prolonged downturn.
Furthermore, macroeconomic factors such as inflation rates, interest rates, and global economic stability will play a significant role in Bitcoin’s future performance. As institutional interest continues to grow, Bitcoin’s adoption as a store of value may also evolve, impacting its price dynamics. Investors should consider these broader trends, alongside technical analysis, to develop a comprehensive understanding of Bitcoin’s potential future movements and make informed investment decisions.
Risk Management Strategies for Bitcoin Investors
Risk management is essential for Bitcoin investors navigating the volatile cryptocurrency market. Given the potential for significant price fluctuations, establishing a robust risk management strategy is crucial for protecting investments. This includes setting stop-loss orders, diversifying portfolios, and only investing what one can afford to lose. Understanding Bitcoin’s price movements and the various factors influencing them can help investors make more informed decisions and mitigate potential losses.
Additionally, staying informed about market developments and technical indicators can provide valuable insights for adjusting risk management strategies. As Bitcoin continues to demonstrate high volatility, having a clear plan in place can help investors remain calm during market fluctuations. By prioritizing risk management, investors can better position themselves for long-term success in the ever-changing cryptocurrency landscape.
The Impact of Regulatory Changes on Bitcoin Prices
Regulatory changes can have a profound impact on Bitcoin prices, influencing market sentiment and investor behavior. As governments worldwide grapple with how to regulate cryptocurrencies, any news regarding legislation or regulatory frameworks can cause significant price swings. For instance, favorable regulations may boost investor confidence, leading to bullish trends, while stringent regulations could spark fear and drive prices down. Understanding the regulatory landscape is essential for Bitcoin investors seeking to navigate these complexities.
Investors should stay abreast of developments in cryptocurrency regulations, as these can directly affect Bitcoin’s market dynamics. Monitoring news from influential regulatory bodies can provide insights into potential future price movements. Additionally, engaging with community discussions and analyses can help investors gauge the sentiment surrounding regulatory changes and their potential impact on Bitcoin’s value. By being proactive about regulatory developments, investors can better position themselves to respond to market shifts.
Frequently Asked Questions
What are the key indicators in Bitcoin price analysis for predicting future trends?
In Bitcoin price analysis, key indicators include the Relative Strength Index (RSI), Moving Average Convergence Divergence (MACD), and Fibonacci retracement levels. These tools help assess whether Bitcoin is in a bullish or bearish trend and can indicate potential support levels and price forecasts.
How does the current Bitcoin cycle affect BTC price forecasts?
The current Bitcoin cycle plays a crucial role in BTC price forecasts. Analyzing Bitcoin’s historical cycles can provide insights into potential price movements. For instance, if Bitcoin has recently reached a market cycle high, it may indicate a corrective phase, affecting future predictions for BTC.
What are the significant support levels for Bitcoin price analysis?
In Bitcoin price analysis, significant support levels are crucial for determining potential price bottoms. Currently, the support range between $93,910 and $95,700 is critical. If Bitcoin holds above this level, it may signal a bullish trend continuation; if it breaks below, it could indicate a bearish trend.
How do bearish trends impact Bitcoin price analysis?
Bearish trends in Bitcoin price analysis indicate a downward price movement, often characterized by lower highs and lower lows. These trends can lead to increased selling pressure and could signal the beginning of a bear market, affecting investors’ confidence and future price forecasts.
What is the role of Fibonacci retracement in Bitcoin price analysis?
Fibonacci retracement levels are essential tools in Bitcoin price analysis, used to identify potential reversal points during a price correction. By analyzing these levels, traders can determine key support and resistance zones, aiding in predicting future BTC price movements.
Is Bitcoin’s current horizontal range indicative of a larger market trend?
Yes, Bitcoin’s current horizontal range, trading between $93,000 and $107,000, suggests consolidation. This price behavior may indicate that the market is preparing for a breakout or breakdown, influencing future BTC price analysis and overall cryptocurrency market trends.
Can Bitcoin’s price analysis help in understanding the overall cryptocurrency market?
Absolutely, Bitcoin’s price analysis is often a leading indicator for the overall cryptocurrency market. Since BTC is the largest cryptocurrency by market cap, its price movements can influence altcoins and the broader market trends, making it essential for investors to monitor Bitcoin closely.
What factors could influence Bitcoin’s price analysis in the coming months?
Several factors could influence Bitcoin’s price analysis, including macroeconomic events, regulatory changes, market sentiment, technological advancements, and trading volume. Monitoring these elements will help in making informed BTC price forecasts and understanding potential market cycles.
| Key Points | Details |
|---|---|
| Bitcoin’s Trading Range | BTC has been trading between $93,000 and $107,000 since December 2024, with a recent peak of $109,356. |
| Current Price Channel | Bitcoin is in a short-term descending parallel channel after reaching its all-time high. |
| Market Cycle Analysis | Uncertainty exists around whether Bitcoin has reached its market cycle high or if further increases are expected. |
| Technical Indicators | RSI is below 50 and MACD is below 0, indicating bearish trends. |
| Support Levels | The critical support level is between $93,910 and $95,700. |
| Potential Price Bottom | If BTC holds above the support levels, it may aim for a rally towards $142,020-$155,326. |
| Market Sentiment | February’s price movements are crucial for determining market direction. |
Summary
Bitcoin price analysis indicates that the cryptocurrency is currently testing critical support levels after experiencing significant price fluctuations. As Bitcoin trades within a defined range, the market is at a crucial juncture where either a breakout or a continuation of the bearish trend could occur. Investors should closely monitor the upcoming price movements in February, as they will likely provide clarity on whether Bitcoin has established a market bottom or is set for further declines.